As improbable as they seem, power figures for electric motorcycles aren’t fabricated. The LiveWire S2 Del Mar actually churns out close to 200 foot-pounds of torque, and Zero’s DSR/X really is good for 169 foot-pounds of twist, as per official European Union testing.
Following that same Regulation 85 engine-dyno homologation protocol, Ducati’s latest 1,100 cc, V-4 superbike makes 89 foot-pounds of torque. And yet our seat-of-the-pants experience tells us that you’d have to be absolutely cross-eyed on vino rosso to think one of these electric bikes would best a Panigale in a drag race.
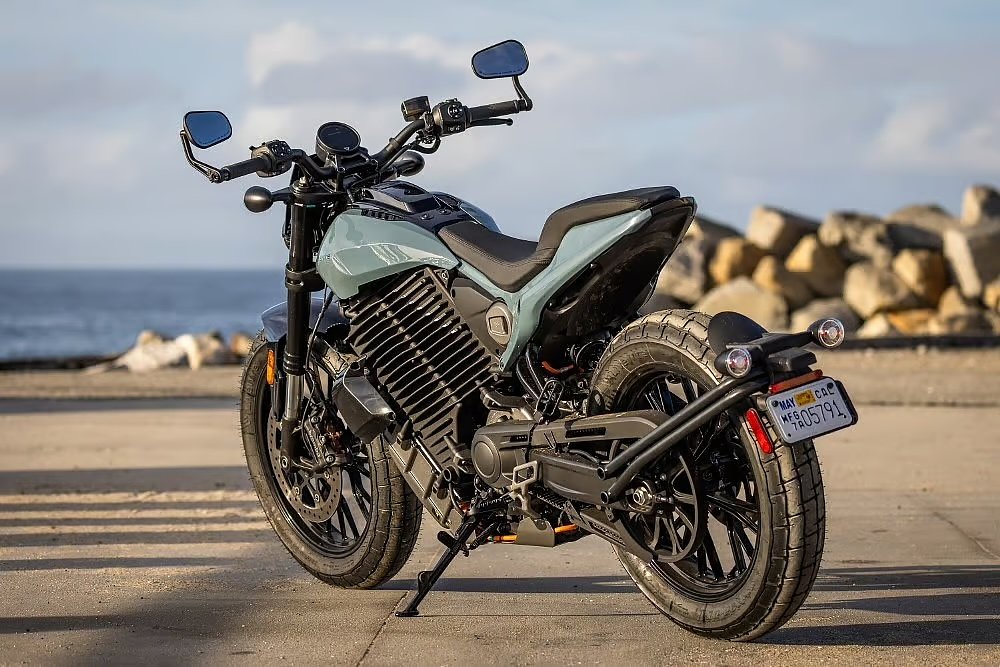
So what in Faraday’s name is going on here? If these battery bikes are producing so much twist, how come they’re not smoking tires and flipping people onto their Shoeis all the time? I mean, 169 foot-pounds would be a jaw-dropping torque figure for a turbocharged Hayabusa, and the DSR/X doesn’t feel much faster than an MT-07.
Well it’s not BS, and it’s not clandestine wheelie control or torque limiting off the line, even if those are common explanations, that, admittedly, I’ve indulged in myself. No, it’s actually much simpler and a lot less exciting than that: Torque figures on electric motorcycles don't give you a good idea of how their acceleration compares to gas-powered motorcycles, because electric bikes don't commonly have a transmission.
To understand why that matters, we have to talk about how motorcycle performance is evaluated in the first place. Whether it’s on an engine dyno (which measures output at the crankshaft — this is fairly rare equipment in the motorcycle world, typically only used by manufacturers and regulatory bodies) or a chassis dyno (that measures power at the rear wheel, i.e. the ubiquitous DynoJet 250i), the objective is to represent engine performance. And therein lies the problem.
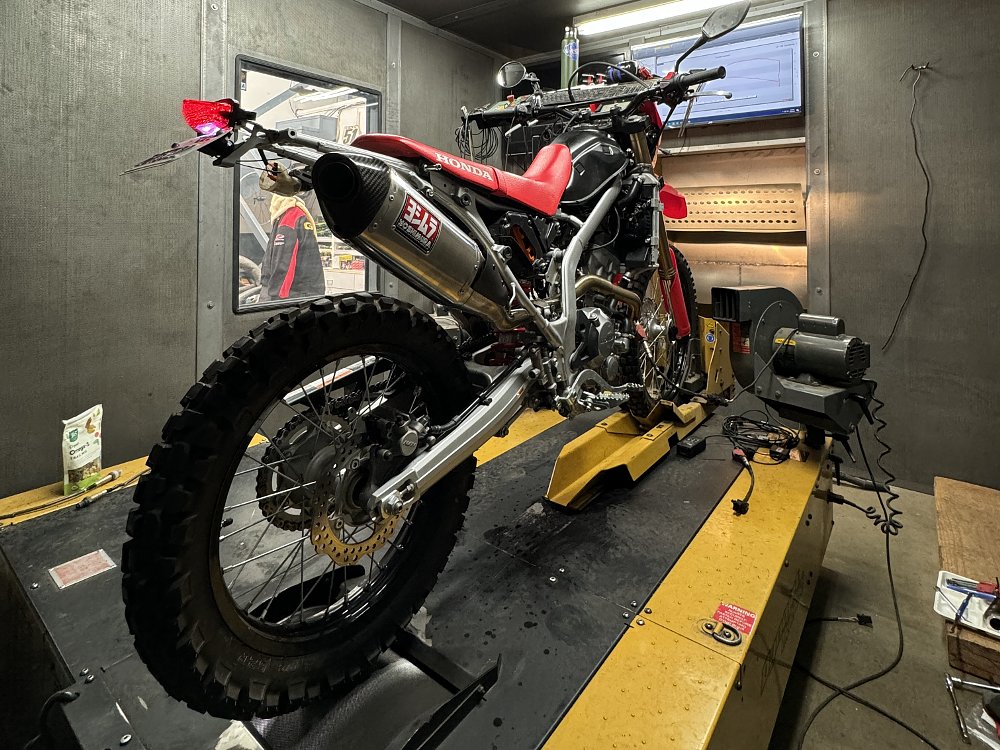
We don’t ride engines. We ride complete motorcycles that push the crankshaft’s torque through a series of gears that manipulate the engine’s output in dramatic ways. With an ICE bike’s primary reduction, six-speed transmission, and final-drive ratio, we could be talking about a multiplication factor of 14 or 15 in first gear. With an electric bike’s single-reduction setup, it’s often more like four or five. Either way, the torque that’s reported on spec sheets and dyno charts looks very different when it finally arrives at the rear wheel.
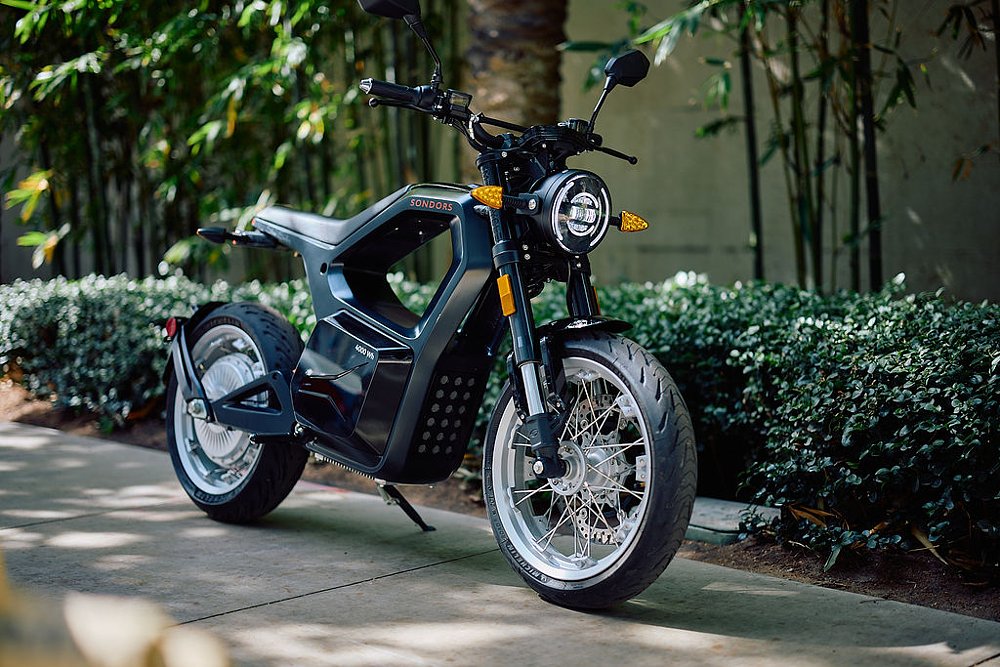
If we shift our focus from the spinning shaft that’s producing the torque to the rotating tire that’s transferring that force to the ground, two things will happen. First, you’ll be shocked at the magnitude of the numbers, represented in pounds of thrust (the pushing force active between the rear tire’s contact patch and the road), and second, you’ll have a better and potentially more accurate way to assess how fast a bike is and what it will feel like when you twist the throttle.
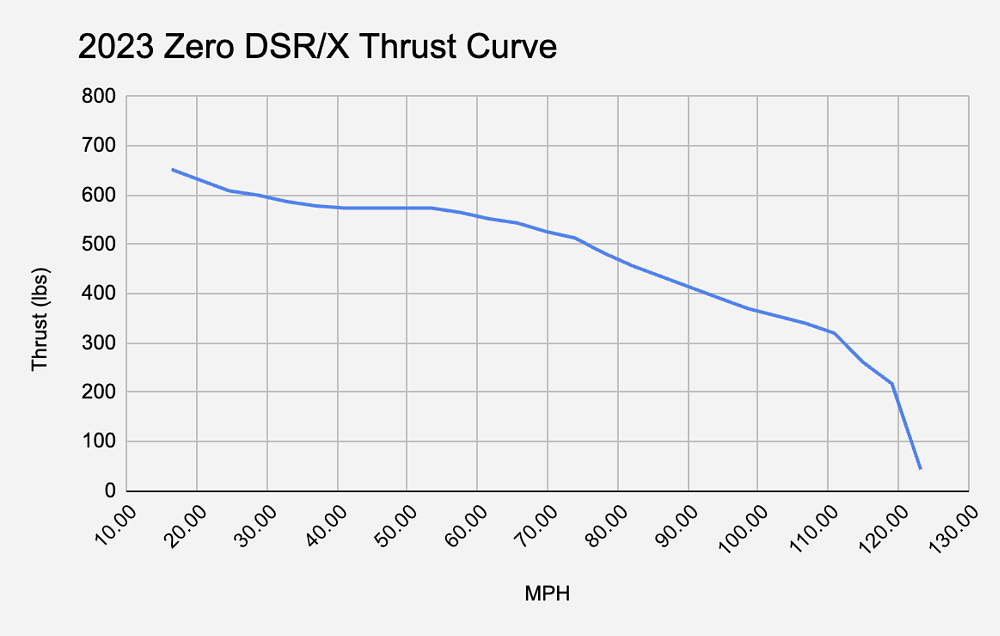
Below is a chart representing the Zero’s ground thrust, graphed against speed. If you thought 169 foot-pounds of torque was a big number, how about 650 pounds of thrust? That’s what you get when you multiply the motor torque by the total gearing, then divide by the radius of the rear wheel.
Now, here are the combined thrust curves (one for each gear) for an MT-07, the middleweight naked I compared the DSR/X to earlier. The MT-07 only makes 50 foot-pounds of torque, but thanks to its transmission, it matches and even briefly exceeds the Zero’s ground thrust below 40 mph in first gear.
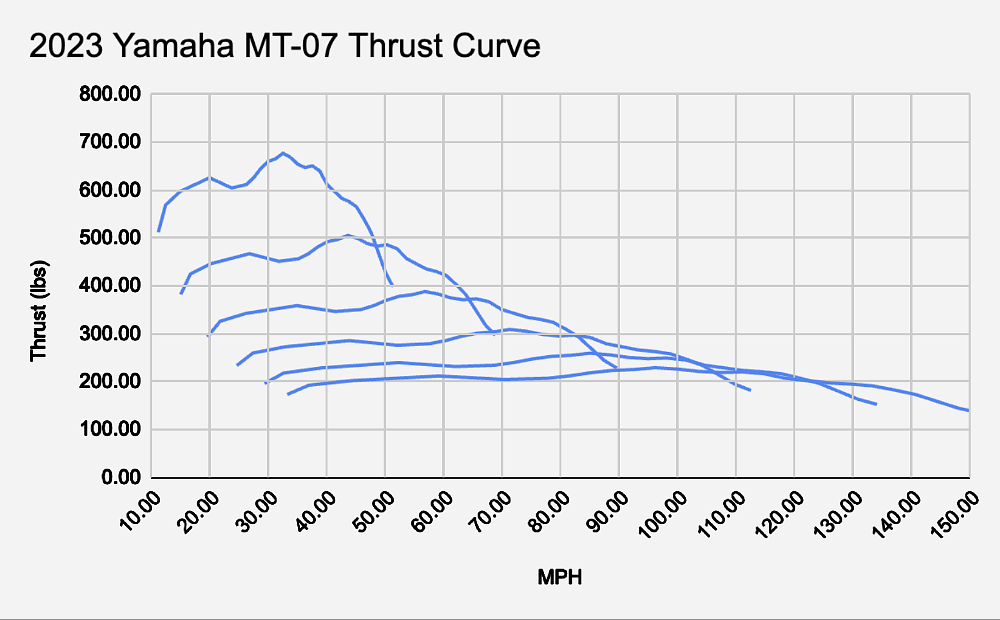
Even though the Zero’s 169-foot pound torque spec sounds insane, the thrust it yields is within the norm, albeit flavored by the unique characteristics of its electric motor and direct drive setup.
A thrust curve is an excellent representation of the force shoving you down the road at any given speed, which is arguably more helpful than knowing the motor torque at a given rpm, which is what a standard dyno chart shows. It’s easy enough to output thrust on DynoJet equipment, but unfortunately independent dyno testing in general is losing ground to manufacturers' stated power figures, so I don’t expect thrust curves to become commonly available information.
So, how are riders supposed to wrap their heads around an electric bike’s potential performance based solely on printed specs? It’s an imperfect solution that I’m almost embarrassed to recommend, but my suggestion is to apply correction factors, just like dynameters do. Or maybe it’s easier to think of as a conversion rates, like you’d use with foreign currency.
If you multiply the manufacturer-supplied torque figure by 0.4 and horsepower by 0.6 you’ll end up with crudely normalized numbers that more accurately represent what the bike will feel like. At least, based on our perceptions of what equivalent rear-wheel-converted-to-crankshaft numbers would feel like on an ICE bike.


